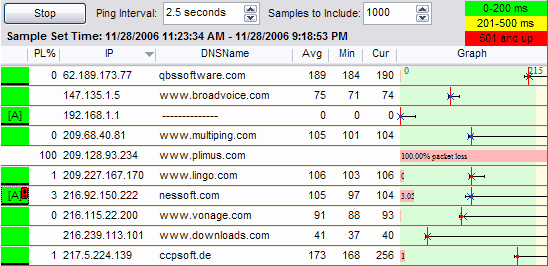
Targets Graph

The "Targets" graph is a list of all the targets that are currently being pinged. This can be sorted by clicking the column header that you want to sort by, and can be manipulated in a variety of ways by right-clicking on the grid.
There are a number of columns that can be displayed on the Targets Grid. Some of these are optionally displayed, and they can be shown / hidden by right-clicking on the grid and using the "Customize View" menu option. The colors displayed and indicators are customizable.
Note: all statistic columns use the "Samples to include" setting to know how many samples to examine.
Status Column
The Status column is always displayed as the left-most column in the grid. This is used to show if an alert is applied to this target, and also if there is a time-graph visible in the main screen.
When a time graph is visible for a target, the status column has a thick black bar. Double-clicking on that will turn the time graph on and off.
![]()
When an alert is associated with a target, a bracketed A will appear.
![]()
When an alert is "alerting" for a target, an exclamation point will appear on that target.
![]()
Floating your mouse over the exclamation point will show more details about that alert.

The exclamation point only appears if you're looking at the current time period. If you go back and look at history, the alert "exclamation point" will not appear.
Err Column
The "Err" Column shows the number of lost packets. This is an exact numeric count, is not an error code, but just an error count.
PL%
The PL% column is the percentage of lost packets. This is the Err (above) number, divided by the number of samples collected. This normally matches the "Samples to include" number after enough samples have been collected.
IP
This is the IP Address for this target. Every target has an IP Address, and each IP Address can only exists in the list once.
DNSName
This is the best name that MultiPing can determine for this target. If you entered the target in name form, rather than IP Address form, then that name will be displayed. If you entered an IP Address, then this is the reverse resolved name. If you entered the target in the form: "192.168.10.23 My Server Name", then "My Server Name" will be displayed here. You can use this mechanism to use your own names for the targets.
Avg
This is the true average latency for this target. Total the latencies, divide by the count and you'll have what is displayed here. A lost packet does not contribute to this average, however.
Min
The lowest latency in the period.
Max
The highest latency in the period.
Cur
The most recent sample collected. This might be "ERR" if the most recent sample was a lost packet. If you're looking at data in the past, this is the most recent sample in the period under inspection.
Graph
This is a great column of the grid. This shows a Min/Max line (unless it's hidden), a blue current "X" (most current sample), and a red "average" line (the vertical line). Packet loss is also displayed here as a light red bar, which gets longer as the packet loss increases.
