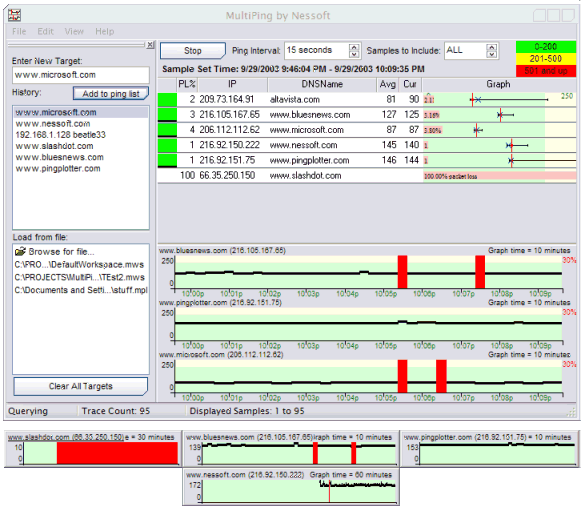
Below is a screenshot of MultiPing in action. At the top of the screen is the main MultiPing window where you can see we're simultaneously monitoring six different sites. Below that are the timeline graphs where you can scroll back and forth throughout the monitoring period. As you can see from the screenshot, the timeline graphs are also "floatable".

